Warning! – The reason I wrote this post is because I was curious about what type of load a t2.nano EC2 instance can handle. I also wanted to demonstrate how CloudFront reduces response times for a website and how the output of a modest instance could be improved by using CloudFront. If you are running an important high traffic site, I recommend implementing best practices for performance and availability, such as using bigger instance types, ELB, Autoscaling, a dedicated RDS instance and read replicas (and also a little help from CloudFront).
Now let’s get started…
Back in December 2015, AWS announced the availability of a new EC2 instance type: the t2.nano. With 512MB memory, 1vCPU and a cost of less than $5/month, this instance type is the smallest and cheapest in the EC2 family – even cheaper if you look at the reserved rates in the US East region ($3/month for 1 year and $2/month for 3 years)
Less than 5 bucks a month is great, but… can you run a decent workload using the smallest EC2 instance type? Thanks to AWS CloudFront, the answer is yes!
AWS CloudFront is a Content Delivery Network that caches your site’s content in multiple locations around the world. If you use CloudFront, visitors to your site access content that is cached in a location nearest to them, instead of reaching your own web server. This results in fast loading times for your customers and decreased load on your server. Like most AWS services, CloudFront is designed to handle enormous traffic, so you don’t have to worry about scale.
Setup
WordPress
For this example, I set up a WordPress blog in a t2.nano instance with a 8GB EBS volume (SSD). I followed the steps in this tutorial. To make the test more realistic I also loaded 700 blog posts to my WordPress installation using the Demo Data Creator plugin. I also have a New Relic agent installed, which I use to visualize metrics that are not available in CloudWatch, such as memory consumption or resource consumption at the process level.
CloudFront
CloudFront supports two types of distributions: 1) Web (static or dynamic files using HTTP and HTTPS) and 2) RTMP (for streaming audio or video files). Since I will be hosting a WordPress blog, I created a Web distribution.
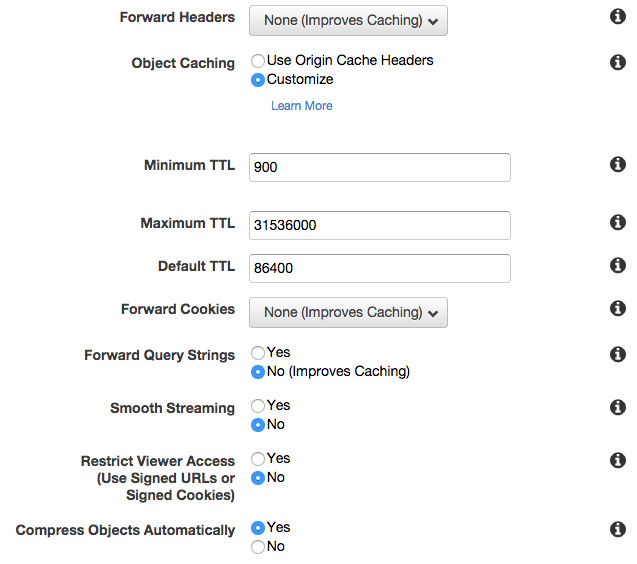
I set up the Minimum TTL (Time to Live) value to 900 seconds, meaning CloudFront will cache the site’s pages for at least 15 minutes before CloudFront looks for new content from the t2.nano instance. You can play with this value, just remember that frequent updates result in more hits to the server. Larger values result in less “fresh” content. I also set “Compress Objects Automatically” to “Yes”, to take advantage of this feature that reduces the use of bandwidth between clients and CloudFront distributions. I set the Origin to the public DNS of my t2.nano instance.
JMeter
I ran performance tests using Apache JMeter. JMeter is an open source performance test tool that simulates concurrent users, sends requests to a predefined HTTP endpoint (your site) and records results. For this post, I executed two performance tests. One sending requests to the t2.nano instance directly and one sending requests to the CloudFront distribution. I used as an input a .csv file with the URLs of the 700 blog posts I previously loaded to my WordPress installation running in the t2.nano.
The best practice in performance tests is to always generate traffic load in a separate server from the one being tested. This ensures test results are not affected by the expected resource consumption in the load generator server. Therefore, I set up JMeter in a separate EC2 instance running in the US East AWS region. And because I don’t like to spend $$ unless I have to, I installed JMeter in a t2.nano!
I used the AWS Logs agent in my JMeter server and configured AWS CloudWatch Logs metric filters to measure my load test results.
Tests
1) Hit the t2.nano (benchmark test)
The intention of this test is to see what type of traffic a t2.nano instance can handle reliably without using CloudFront. For this test, I ran 10 concurrent users (JMeter threads) against the WordPress blog hosted in the t2.nano. I configured a random think time of 30 to 45 seconds between requests. In real life, the think time would be the time a user spends reading a blog post before navigating to a different post. This alone is some pretty decent traffic that our friend the t2.nano can handle. Depending on how long your users stay and how many come back, a constant of 10 concurrent users can turn into thousands of unique visitors in a single month.
One thing I like about the t2.nano is that its modest 512MB-RAM is sufficient to sustain a WordPress blog with low traffic. Before I started the test, memory consumption was around 50%. Once I started the test with 10 concurrent users, memory consumption reached between 57% and 60%, which I consider a safe range that would allow for some intermittent spikes.

CPU did not exceed 6% during this test:
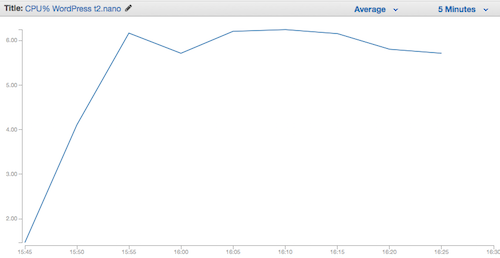
One thing to consider is CPU credits. Let’s assume we start with the initial balance of 30 CPU credits (the credit balance t2 nanos get at launch time). At a constant CPU consumption of 6%, each minute we would consume 0.06 CPU credits and we would earn 0.05 CPU credits. At this rate, it would take 3000 minutes, or 50 hours, to exhaust 30 CPU credits. When this happens, the t2.nano CPU usage will be capped at 5%, which will likely be enough to still handle 10 users. Without CPU credits left, the CPU performance will not increase to handle spikes in usage. This would result in longer response times and possibly failures if traffic goes significantly beyond 10 concurrent users for an extended period of time.
For more on CPU credits, you can also read this article.
New Relic gives me a useful view of resource consumption by process. In this example we can see that most resource consumption takes place in the Apache web server:

10 concurrent users with a random think time of 30-45 seconds resulted in ~0.3 requests per second, or ~18 requests per minute.
And now my favourite section – response times:
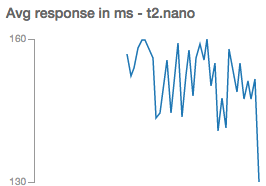
The average response time is < 160 ms. Since my JMeter server is in the same AWS region (US East 1) as my WordPress server, I was expecting to see low response times. In real life, users would experience more than 160 ms responses, depending on which part of the world they are located in. A more complete test would be to set up a distributed JMeter test with servers in multiple AWS regions around the world.
Since I used CloudWatch to aggregate my JMeter results, I don’t have P90 or P99 metrics in this test (metric math is definitely a missing feature in CloudWatch). For this example, average values are good enough.
2) Hit the CloudFront distribution
For my second test, I ran 100 concurrent users (JMeter threads) with a random think time of 30-45 seconds between requests and I pointed at the CloudFront distribution instead. When CloudFront receives an incoming request from a web user, it first tries to find the web page in its cache; if it cannot find it then it fetches the content from the origin server (in this case the t2.nano). This way, the load on my WordPress server is reduced significantly. Additionally, CloudFront stores copies of these cached pages in multiple edge locations around the world. This means visitors from South America will access a copy of my content stored near South America (and get better load times in their browsers!) instead of hitting my WordPress server, which is hosted in North Virginia.
At the beginning of the test, there will be no cached pages in CloudFront. During this period of ~15 minutes, most requests were forwarded to the t2.nano instance. Memory consumption in the t2.nano started at 20% and it stabilized at 50%. This is an improvement over the 57%-60% consumption that the instance experienced in the 10-concurrent-users test.

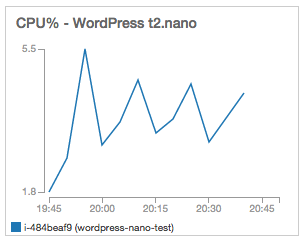
Now let’s take a look at CPU usage in the t2.nano. There is a ramp up in CPU during CloudFront’s cache warm-up, followed by a decrease, when requests were mostly served by CloudFront. The important part here is that CPU credits will not be depleted over time, since usage is below the baseline of 5% that is available for the t2.nano instance. The way CPU credits work, usage above 5% results in credit depletion; usage below 5% results in credit accrual. In other words, this is a sustainable CPU usage.
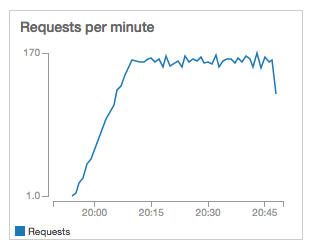
And now the requests per minute, which increased proportionally compared to the 10-user test.
Finally, the response times. Excepting the ramp up period, response times did not exceed 50ms and remained at ~20ms:
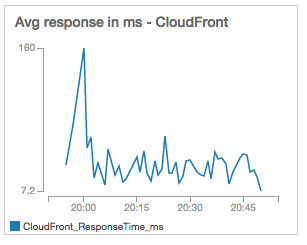
By introducing CloudFront, I increased the number of concurrent users 10x to 100 with a sustainable CPU consumption of less than 5% (which will not deplete my instance’s CPU credits). CloudFront also delivers a much better experience to visitors by reducing response times significantly (in this experiment, from ~160ms to ~20ms)
Conclusions
- The t2.nano is a very useful instance capable of running workloads such as a low-traffic WordPress blog or a JMeter load generator. They are great instances for doing training and some development and testing (depending on the applications you are developing or testing).
- I wouldn’t recommend a t2.nano for running an important blog that serves hundreds of concurrent users, but I would consider using one to power a low-traffic or non-critical internal site. In this test, the t2.nano alone could reliably handle 10 concurrent users with a think time of 30-45 seconds between requests.
- I will continue to use t2.nano instances to run tests, execute operational scripts or as JMeter (or Locust) load generators.
- It is possible to serve thousands of visitors a month using a t2.nano EC2 instance and a CloudFront distribution. Keep in mind that due to TTL settings, there will be periods of time when CloudFront will request content from the origin. The origin must be able to handle the volume of incoming requests from CloudFront during these windows.
- For a performance test that uses CloudFront, high volume and a small instance type, assign sufficient ramp-up time before reaching the full number of concurrent users. Otherwise CloudFront won’t have all the content in its cache during an initial high traffic period and the test instance will be overwhelmed. For this test, I set up the ramp-up time to 15 minutes.
- I don’t recommend using a t2.nano to power a critical, high-traffic WordPress site. In such a case, I recommend using a combination of large instance types, ELB, Autoscaling and RDS with read replicas.
- It’s great to have a useful instance type at $5/month (on-demand), $3/month(1-year reserved) or $2/month(3-year reserved)!
